

Key takeaway
The headline numbers for the used market look stable. Look one layer down and the picture is sharper: lower-priced cars are moving meaningfully faster than the overall lot, and shoppers are squeezed by payments more than prices. The dealers who win in this market are not the ones with the prettiest sites — they are the ones whose online inventory matches operational reality, and whose leads reach the sales team while the car is still available.
The headline market looks stable. Affordability is the pressure point.
Cox Automotive's May 2026 reading shows about 2.12 million used vehicles on dealer lots and an overall 45 days' supply. The average listing price is $26,918, up 6% year over year, while the used retail sales pace is down 3.9% year over year. Read together, that is a market that is not short of inventory in total, but is selling more slowly at higher prices.
For an operator, that combination is uncomfortable in a specific way: a unit that sits longer at a higher cost basis depreciates against you while you pay to hold it. Pricing discipline and turn speed matter more than they did a year ago.
The real shortage is under $15,000
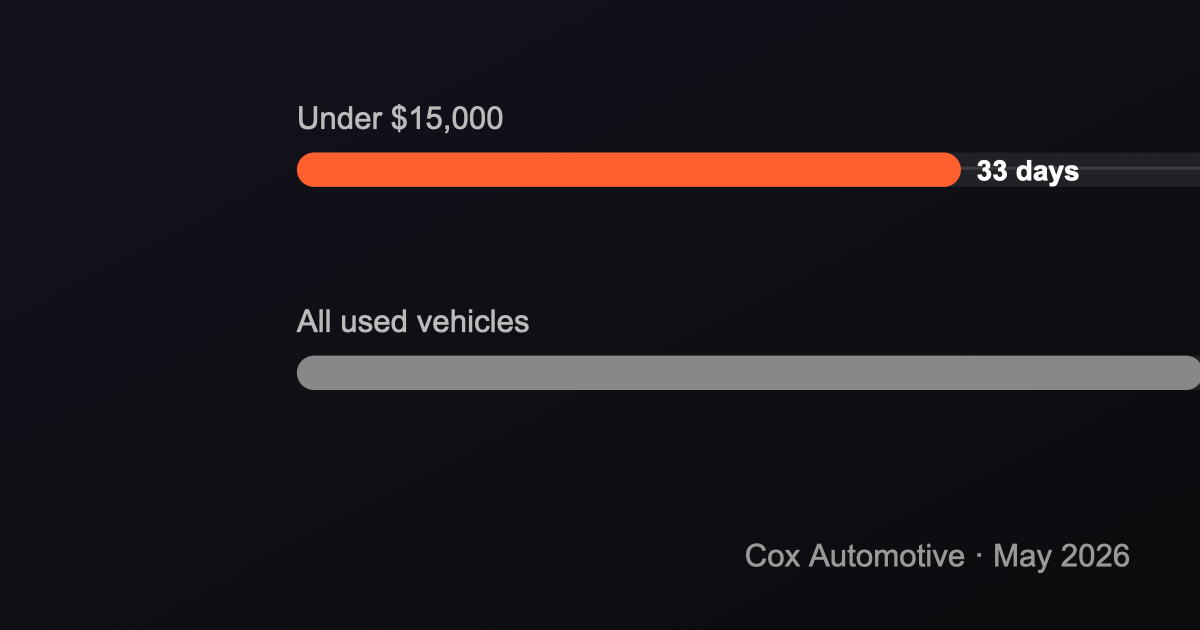
Inside that 45-day average sits the part of the lot that actually moves: vehicles priced under $15,000 carried just 33 days' supply in May 2026. That is roughly 27% below the overall market, and it understates demand because affordable inventory is what most shoppers are searching for in the first place.
Affordable cars are not just cheap listings. They are high-intent magnets: a buyer browsing a $13,900 vehicle is closer to a decision than one comparing $35,000 trims. They are also the listings most likely to generate multiple inquiries on the same unit in a short window. Which is exactly why letting that unit linger on the site after it is booked is the most expensive mistake on the page.
Buyers are shopping payments, not prices
Experian's Q1 2026 State of the Automotive Finance Market report shows what the affordability squeeze looks like under the hood. For used vehicles, the average loan amount was $27,070 (up $785 year over year) and the average monthly payment was $531, up from $523 the year prior. Roughly 31.54% of used-vehicle loans now run longer than six years, up from 28.60% a year earlier.
The behavioral implication is concrete: more shoppers filter by monthly payment first and vehicle second. They are not browsing the lot; they are reverse-engineering it from a payment they can absorb. A site that does not surface affordable inventory cleanly — accurate price, available financing CTA, an obvious "what's the payment" path — loses them to a competitor who does.
Why outdated inventory hurts more in this market
When the affordable end of the lot is moving in roughly five weeks, the operational cost of a stale listing compounds quickly. The pattern is predictable:
- A buyer finds an affordable vehicle online.
- The car is already sold or booked — the website has not caught up.
- The buyer loses trust in the entire listing page and bounces.
- The sales team spends time chasing a lead they cannot close.
- Lead-quality reports look worse than the demand actually was.
The damage is not just the lost unit. It is the next three listings that shopper will not click on, because the site has trained them not to.
What dealership websites should do differently in 2026
None of the following requires a redesign. They are operational defaults that should be in place when the affordable end of the lot is this tight.
- Sync inventory automatically from the source of truth. The feed should drive the site; the site should not be a separately-edited copy of the feed.
- Hide sold and booked vehicles fast. Within minutes of a unit being marked booked in the CRM/DMS, it should be off the public catalog. Feeds alone are not fast enough for that — webhooks are.
- Keep VIN, stock number, mileage, price, photos, and status accurate. Mismatches at any of these fields read as "untrustworthy site."
- Send leads into the CRM/DMS with full vehicle context. A lead without VIN/stock is a lead the team has to re-investigate.
- Prioritize fast response on affordable inventory. First responders win these buyers; "we'll get back to you tomorrow" loses them.
- Make VDPs clear on price, availability, financing CTA, and the next step. Payment-first shoppers should not have to guess.
Used EVs: a separate inventory story
Cox Automotive's May 2026 EV Market Monitor shows used EVs trending on a different curve from the rest of the lot: 31 days' supply (down 23.3% year over year), 42,923 units sold in May (up 24.7% year over year), and an average listing price of $37,083. Used EVs are still a small slice of the total market (about 2.8%), but the velocity is the story — they are moving faster than the overall used lot and faster than they were a year ago.
For dealerships stocking used EVs, the VDP needs to do work the gas-vehicle template was not built for: remaining battery warranty, range estimate, charging port type, recent battery health if available, and a plain-English picture of total cost of ownership. Buyers shopping used EVs are doing more research per unit; a generic VDP leaves money on the table.
What this means for dealers
- The lot is not short on inventory in total — it is short on the inventory that moves.
- Pricing has run ahead of sales pace; turn speed protects margin in this environment.
- Payment-shopping is the dominant buyer behavior; the VDP and site flow should reflect that.
- Stale online inventory in the under-$15k bucket is the single most expensive default to leave in place.
- Used EVs are a faster, more research-driven niche; the VDP template needs different fields.
Dealer takeaway
In an affordability-constrained market, the dealership website should work less like a brochure and more like an operational layer connected to inventory and lead flow. Feeds keep the catalog correct. Webhooks close the gap between "booked" and "still online." Clean lead delivery into the CRM/DMS keeps the team fast where it matters most — at the affordable end of the lot, where buyers are choosing between you and the next dealer that responded first.
Sources
- Cox Automotive — Used-Vehicle Inventory, May 2026: 2.12M total inventory; 45 days' supply overall; 33 days' supply under $15,000; $26,918 average listing price (+6% YoY); −3.9% YoY retail sales pace.
- Experian — State of the Automotive Finance Market, Q1 2026: average used loan amount $27,070; average used monthly payment $531; 31.54% of used loans > 72 months.
- Cox Automotive — EV Market Monitor, May 2026: used EV days' supply 31 (−23.3% YoY); used EV sales 42,923 units (+24.7% YoY); average used EV listing price $37,083; used EV share of total used market 2.8%.
- FRED — Used Cars and Trucks CPI: companion retail-side price series shown live in our Insights hub.
Last updated: June 25, 2026.