Picture the same one-star review posted in two different states. A customer describes the same problem in the same words: the car from the website was already sold, nobody called back, the temp tag expired.
In Michigan, that review will hang unanswered with 96% probability. In California, it is more likely to get a dealer reply than not.
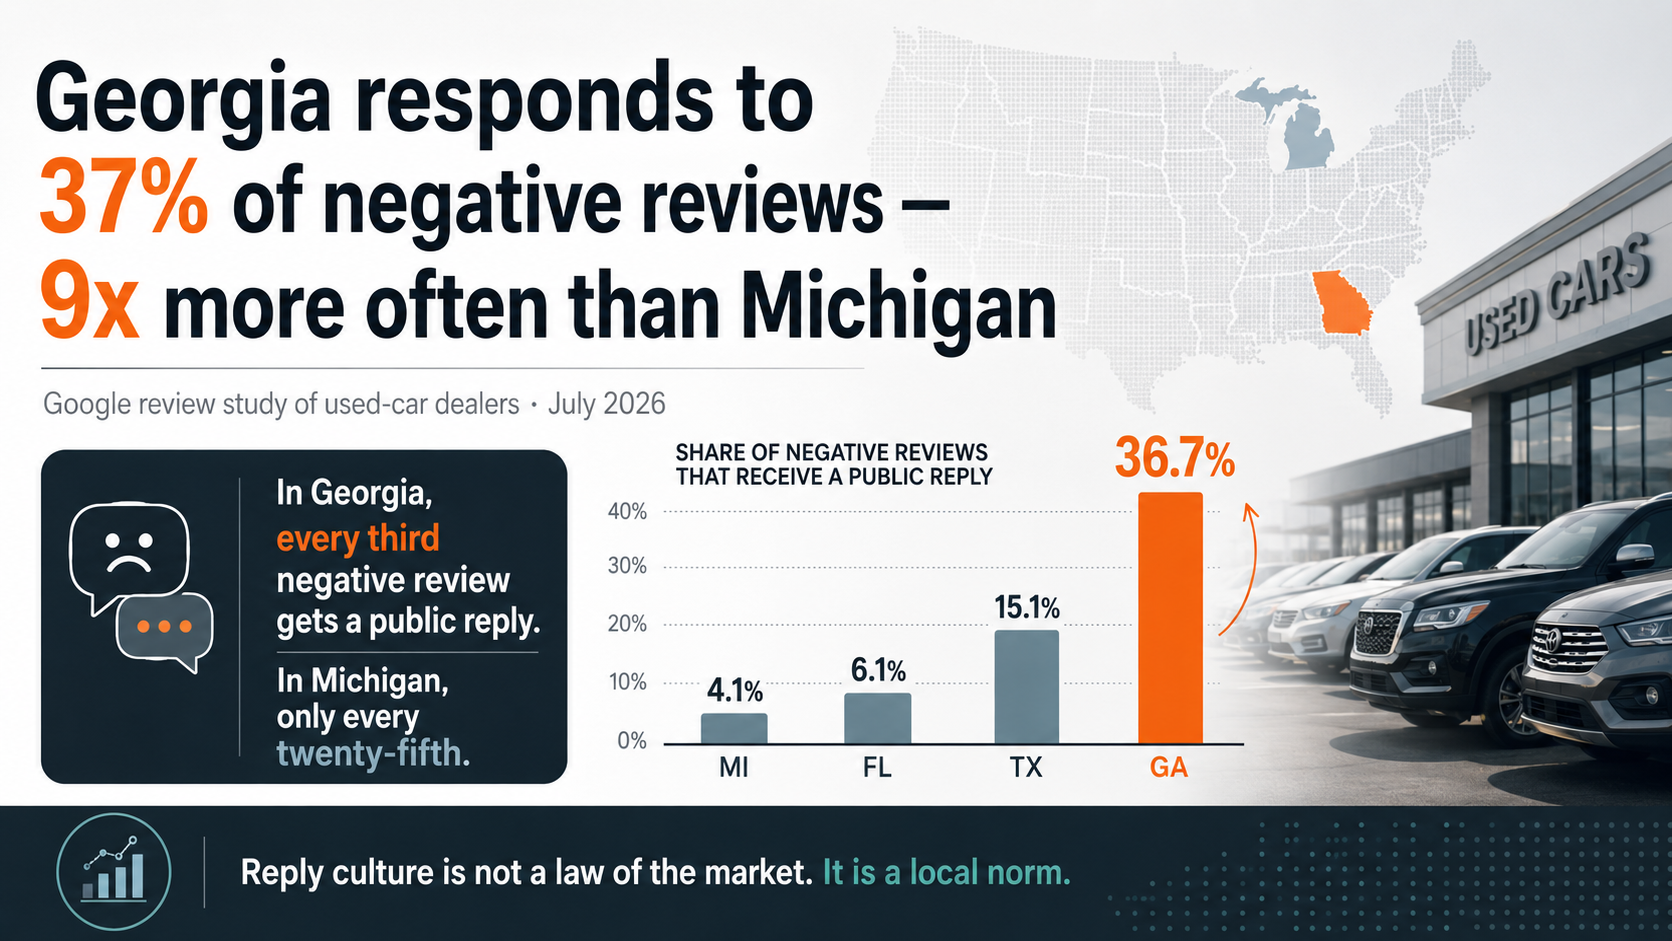
Same industry. Same platform. Same unhappy customer. In part one of this study we measured Michigan's silence: a 4.1% response rate, with 88% of dealers never replying at all. In part two, Georgia broke the assumption that this is simply how the used-car market works, answering 36.7%. Since then, three more states have gone through the same collection design and the same verification protocol.
The dataset now covers five states and 73,170 negative reviews. This article is the map, and an honest account of two explanations that did not survive it. It is also, read closely, a map of service: the complaints themselves barely change from state to state (a car that was already sold, a call that never came back, paperwork that never arrived). What changes is whether anyone on the dealer's side is set up to notice.
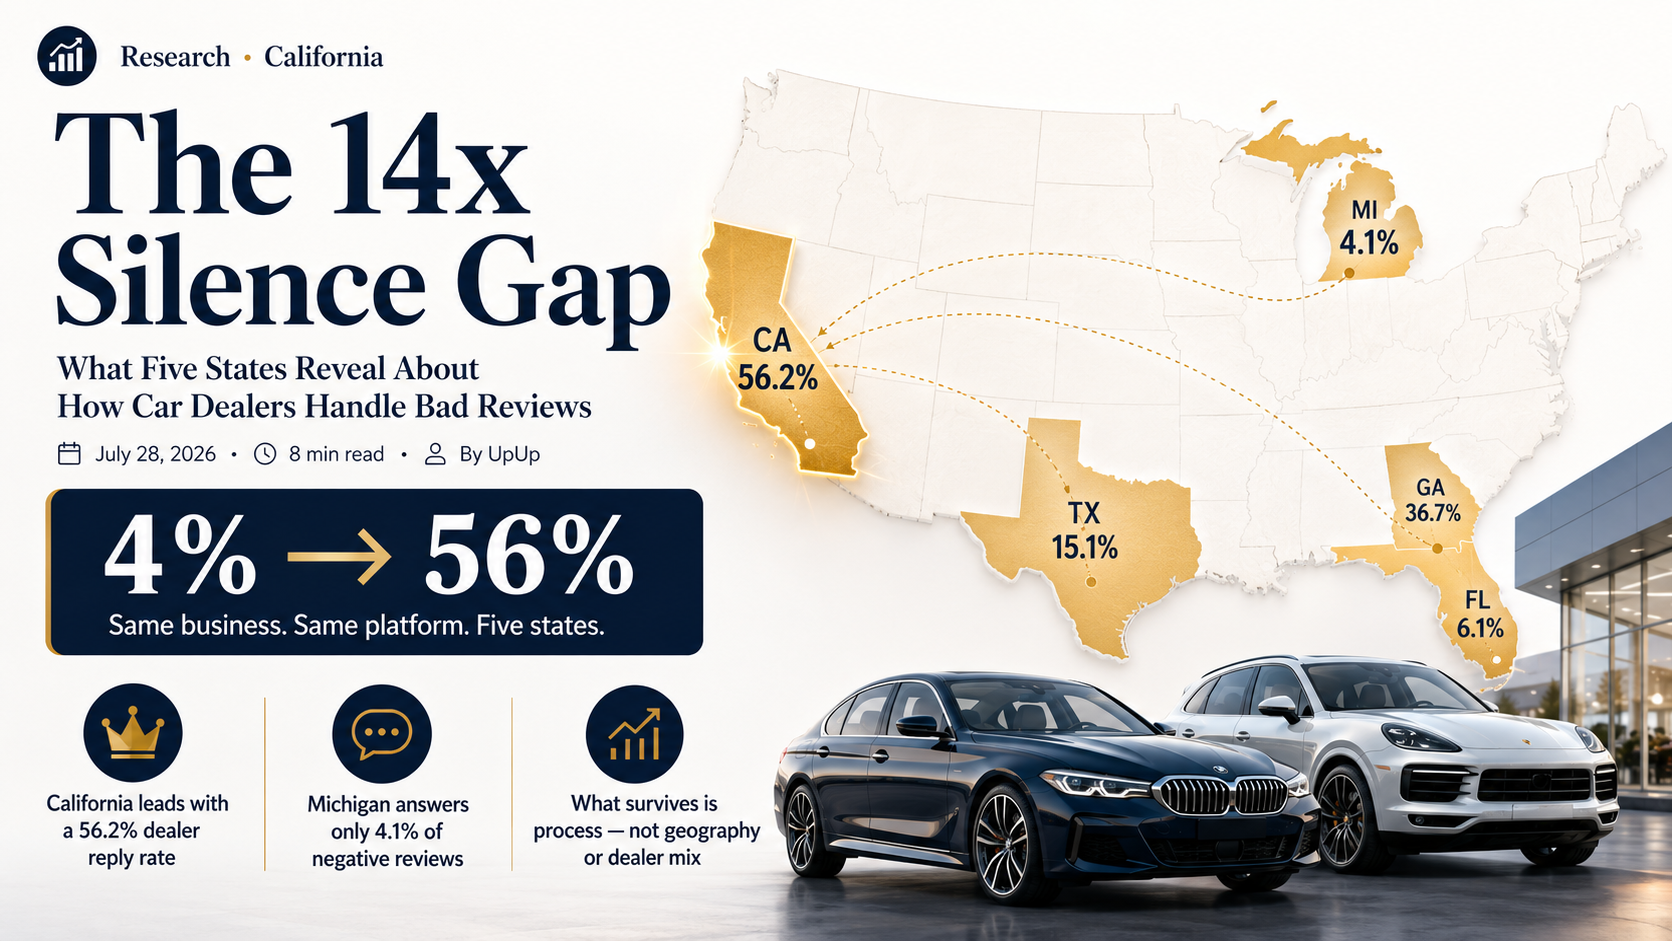
Fact 1: The spread between states is fourteen-fold
| State | Negative reviews | Share with dealer response | One-star only, 2023–2026 |
|---|---|---|---|
| Michigan | 18,116 | 4.1% | ~4.5% |
| Florida | 12,366 | 6.1% | 7.0% |
| Texas | 15,045 | 15.1% | 17.2% |
| Georgia | 15,416 | 36.7% | 37.9% |
| California | 12,227 | 56.2% | 60.0% |
In part two, Florida and Texas appeared as preliminary estimates. They have since passed the full validation protocol (aligned period, one-star-only cut, template and concentration checks), and the numbers held to the decimal.
The right-hand column is the strictest aligned cut: same star rating, same time window. The gradient does not shrink on it. It gets steeper. Within one country, one industry, and one review platform, the odds of a customer hearing anything back range from 1-in-25 to better-than-even.
Fact 2: California is the new record, and the cleanest profile in the study
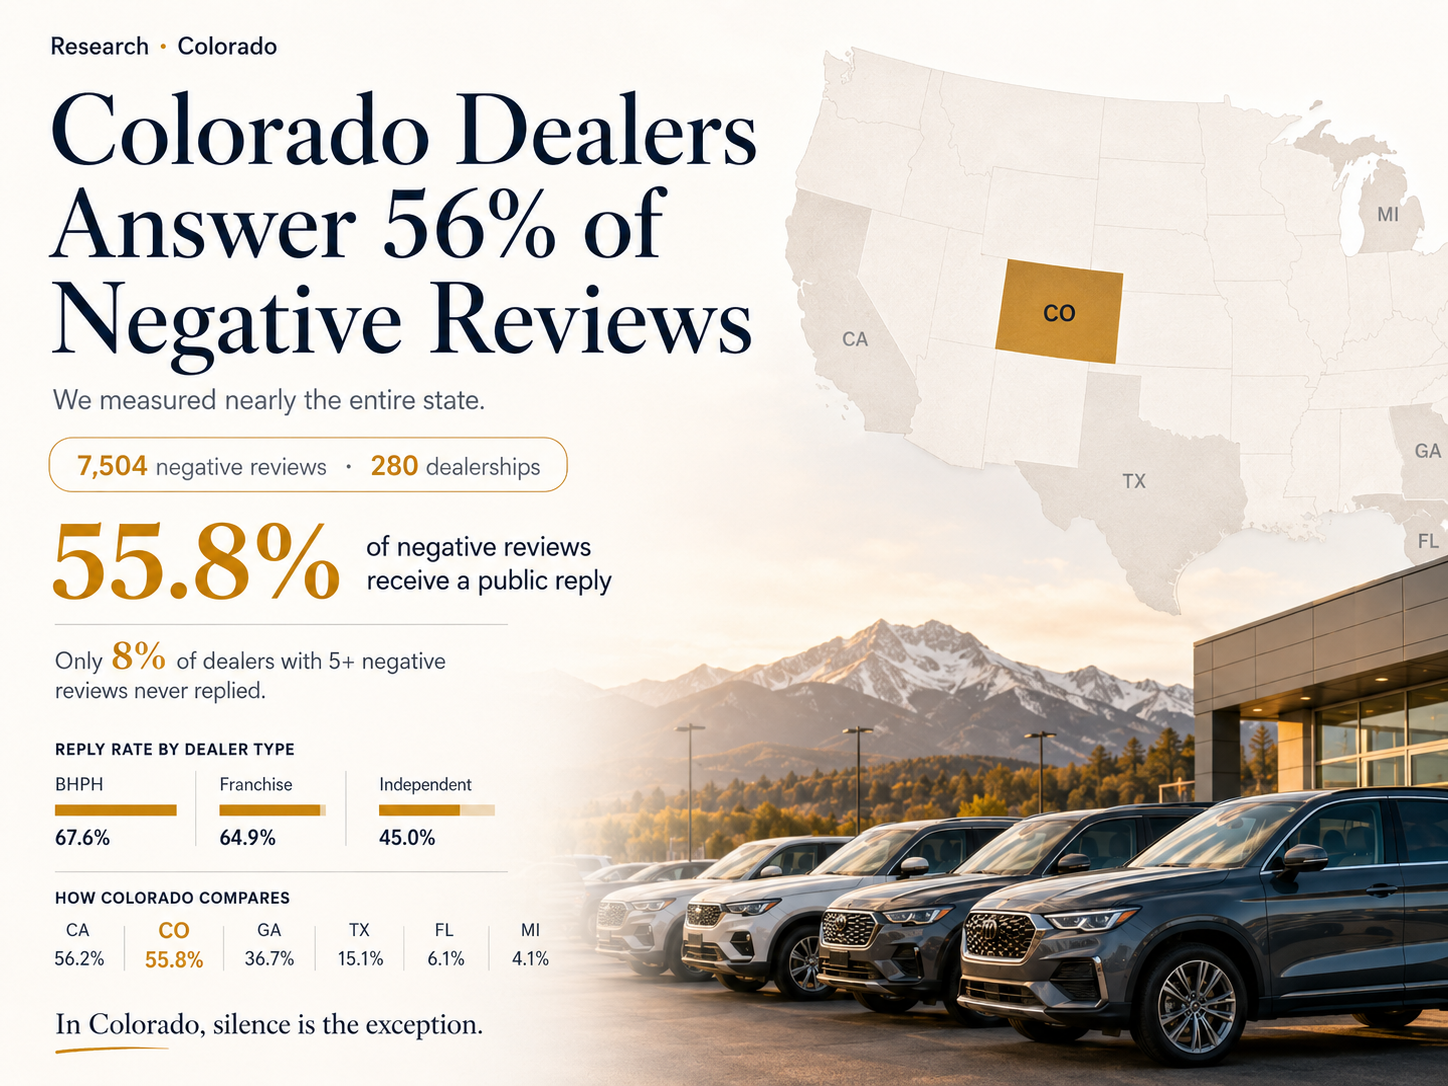
Of California's 12,227 negative reviews, 6,873 (56.2%) have a public dealer response. On the 2023–2026 slice, it is 62.1%.
And the structure behind the number is the healthiest we have measured. Exact duplicate replies (the same text from the same dealer five or more times): 0.8%, the lowest in the study. The ten most active locations produce just 10% of all responses. The median reply is 346 characters, the longest of any state. Dealers who never replied at all: 11%.
California does not answer through copy-paste blasts, and not through a few champion stores. It answers everywhere, in full sentences.
Fact 3: The north-to-south pattern did not survive its fifth state
At the end of part two, the gradient looked temptingly simple: the North stays silent, the South talks. We labeled it an observation, not a conclusion, and that caution turned out to be justified.
California is the West, not the South. At 56.2%, it now sits at the top of the entire gradient. Whatever separates a 4% state from a 56% state, you cannot find it on a map.
Suspect one, eliminated.
Fact 4: It is not the market composition either
The next obvious suspect: dealer mix. California's negative-review volume is 73% franchise stores, and franchises answer more everywhere. Maybe the gradient is just composition in disguise?
It is not, because the gradient lives inside each dealer class separately:
| Dealer class | MI | FL | TX | GA | CA |
|---|---|---|---|---|---|
| Franchise | 5.3% | 5.3% | 16.9% | 44.3% | 63.1% |
| Independent | 0.6% | 9.0% | 14.4% | 26.9% | 33.9% |
An independent dealer in California replies six times more often than a franchise store in Michigan. If dealer type set the behavior, that line could not exist.
Two details bury the composition theory for good. In Florida, independents answer more often than franchises (9.0% versus 5.3%), the only inversion in the data. And the buy-here-pay-here segment behaves in opposite ways depending on the state: in Florida, zero replies across all 502 of its negative reviews; in Georgia and California, 52% and 63%, the highest rates in their states. The same business model, opposite behavior.
The type of dealer does not set the behavior. The market the dealer stands in does.
Suspect two, eliminated.
Fact 5: What survived is process, and you can see it in the numbers
Strip away geography and composition, and what remains sounds unmeasurable: the local norm. Except this norm moves on two very concrete scales, and they move together. The share of dealers who have never replied to a single negative review (among those with five or more), and the share of all responses produced by the ten most active locations, both collapse as a market starts to talk:
| State | Never replied (5+ reviews) | Top-10 share of responses |
|---|---|---|
| Michigan | 88% | 79% |
| Florida | 82% | 39% |
| Texas | 55% | 21% |
| Georgia | 16% | 11% |
| California | 11% | 10% |
Read together, the two scales describe something very specific. In part one we wrote that silence is rarely a decision: it is the absence of a system, with no alert when a review lands, no owner, no deadline, and no link between the public complaint and the internal workflow. The map shows what a market looks like when that system is missing almost everywhere (Michigan, where replying is the niche habit of ten stores against a backdrop of silence) and what it looks like when the system becomes standard equipment (California, where replying is basic hygiene spread across the whole market, in full sentences, with a 0.8% template share).
A talking state is not a state with different people. It is a state where the boring machinery (see the review, assign it, answer like a human, learn from the cause) stopped being optional.
What this means for a dealer
The range itself is the finding: a 4% norm and a 56% norm coexist in the same country, on the same platform, in the same business. Silence is not a property of the car trade. It is a local habit, and to the customer reading your profile tonight, it does not read as a habit. It reads as service: this dealer does not dispute what happened, and does not care.
Which game you are playing depends on your state. In a silent market, the window from part one is wide open: the first dealer who builds even a minimal response system competes against silence itself, and the data says almost nobody will follow quickly. The cost of that advantage is a process, not a budget. In a talking market, the bar has moved. Answering is table stakes, and the competition shifts to what your answers are made of: how fast, how human, and whether anyone traces the complaint back to the thing that keeps producing it. The plates that never arrive, the calls that never come back, the website selling cars that are already gone. Each of those is a process with a missing owner, and the reviews will keep writing about it until someone inside the store is assigned to notice.
Why the gradient exists at all remains open. Of the three living hypotheses (the competitive density of large metro markets, the consolidation of the dealer body, and the penetration of working reputation processes inside dealer groups), the third is the only one that fits everything we can measure: the gradient inside every dealer class, the near-absence of blast templates (under 2% in every state), and answers that get longer, not shorter, as markets talk more. The test will come from classifying what 73,170 complaints actually say, and from the five states still ahead.
Methodology note. 73,170 public 1–3 star Google reviews of used-car dealerships across Michigan, Florida, Texas, Georgia, and California, collected in July 2026 under a single sampling design (about 400 dealers per state: the top 250 by review volume plus a random selection of smaller lots, drawn from validated statewide bases). A “response” means a public owner reply visible on Google at collection time. Because the star composition of samples differs between states (California's, in particular, contains a lower share of one-star reviews), every cross-state comparison is duplicated on an aligned cut (one-star reviews only, 2023–2026), and the conclusions coincide with the overall figures. Response concentration is measured per location, not per chain name. Consumer-behavior context in parts one and two: BrightLocal Local Consumer Review Survey (2024, 2026). Last updated: July 28, 2026.